National Aeronautics and Space Administration
Goddard Space Flight Center

Space Weather Action Center
Sunspot Regions
The Atmospheric Imaging Assembly Tutorial

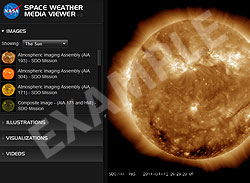
Above: The Atmospheric Imaging Assembly (AIA) for the Solar Dynamics Observatory (SDO). The above image is NOT live data.
Getting to the Data
The easiest way to view this image is by opening the Space Weather Media Viewer. In the "IMAGES" section select "The Sun" from the small drop-down menu. Observe the first 4 images called, "Atmospheric Imaging Assembly (AIA) ". Don't forget to zoom in and pan to the lower left side of the image in order to see the exact date and time of the image. AIA uses filters to allow the camera to record only particular kinds of ultraviolet light. Ultraviolet light is invisible to our eyes and has no color as we know it.
About the Data
AIA 193:
The first of the four images is AIA 193. Coronal Holes are analyzed through this data. A coronal hole is a region of the Sun's corona that appears dark in pictures taken with a coronagraph or during a total solar eclipse, and that shows up as a void in X-ray and extreme ultraviolet images. Coronal holes are of very low density (typically 100 times lower than the rest of the corona) and have an open magnetic field structure; extending indefinitely into space rather than looping back into the photosphere. This open structure allows charged particles to escape from the Sun and results in coronal holes being the primary source of the solar wind and the exclusive source of its high-speed component. During the minimum years of the solar cycle, coronal holes are largely confined to the Sun's Polar Regions, while at solar maximum they can open up at any latitudes.
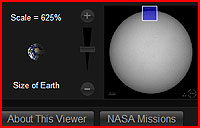
The bright spots in these images tell you that there is a lot of this kind of ultraviolet light being emitted. Dark regions show little activity. Use the Earth in the bottom right zoom box to help you determine the size of the area of bright spots by comparing the area with the size of the Earth.
Solar activity is driven by the evolving magnetic field. Although the coronal magnetic field cannot be measured directly, much of the magnetic field within a few times 105 km from the surface contains hot plasma that is dense enough to emit detectable levels of light. This plasma is (mostly) frozen onto the field lines, so that the emission from (or absorption by) the plasma outlines the magnetic field. The coronal plasma has a wide range of temperatures, emitting brightest at EUV and soft X-ray wavelengths.
AIA 304:
The second of the four images is AIA 304. Solar Prominences are analyzed through this data.
A prominence is a large, bright feature extending outward from the Sun's surface, often in a loop shape. Prominences are anchored to the Sun's surface in the photosphere, and extend outwards into the Sun's corona. While the corona consists of extremely hot ionized gases, known as plasma, which do not emit much visible light, prominences contain much cooler plasma, similar in composition to that of the chromosphere. A prominence forms over timescales of about a day, and stable prominences may persist in the corona for several months. Some prominences break apart and give rise to coronal mass ejections. Scientists are currently researching how and why prominences are formed.
AIA 171:
The third of the four images is AIA 304. Coronal Loops are analyzed through this data.
Coronal loops form the basic structure of the lower corona and transition region of the Sun. These highly structured loops are a direct consequence of the twisted solar magnetic flux within the solar body. The population of coronal loops can be directly linked with the solar cycle; it is for this reason coronal loops are often found with sunspots at their footpoints. The upwelling magnetic flux pushes through the photosphere, exposing the cooler plasma below. The contrast between the photosphere and solar interior gives the impression of dark spots, or sunspots.
AIA 171 and HMI:
The fourth of the four images is AIA 171 and HMI. The Composite Image- Atmospheric Imaging Assembly (AIA 171) and Helioseismic and Magnetic Imager (HMI) analyzes Magnetic Structures:
This composite image shows the HMI magnetic field in blue and orange (indicating opposite polarity) aligned with the AIA 171 channel in extreme ultraviolet superimposed over it. The juxtaposition is especially effective at showing how the arcs that we observe in UV light emerge from regions of strong magnetic field.

Navigation Tips
You can download full size images and save them by clicking on the "Save" button in the lower right side of the viewer.
You can use the controls under the large box on the right to zoom and pan. This feature allows you to see the Sun in great detail. Some small active regions may not be visible until you zoom. The scale under the box on the right compares the size of the Earth with the image. When you click on any image in the viewer it will appear in the large box to the right allowing you to examine each image in detail
You are viewing a tutorial
Related Tutorials
- H-Alpha Full Disk Image of the Sun
- Atmospheric Imaging Assembly
- Large Angle and Spectrometric Coronagraph
The above tutorials compliment the downloadable Flip Charts and Data Sheets.
