National Aeronautics and Space Administration
Goddard Space Flight Center

Space Weather Action Center
Magnetosphere
Alaska Tutorial
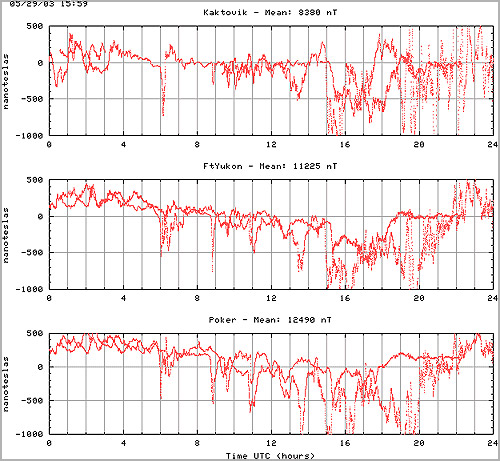
You will be able to get magnetometer data from several sites in Alaska. These magnetometer sites are part of the Geophysical Institute Magnetometer Array. You will be studying data from three sites; Kaktovik, Ft. Yukon, and Poker Flat. The Alaska link will provide you with plots like the ones below.

Above: Graph of data from Alaska Magnetometer. THIS IMAGE IS NOT LIVE DATA.
This shows the horizontal component 'H' magnetograms for three locations in Alaska. Previously you were given the X-component (north-south) and the Y-component (east-west). The H-component is the size of the entire horizontal part of the magnetic field. It is a special combination of the X and Y. Again the large average field strength is subtracted so that you can see changes more easily. The greater the deflection or difference from zero, the greater the storm.
You are viewing a tutorial
Related Tutorials
The above tutorials compliment the downloadable Flip Charts and Data Sheets.
