The Goddard instruments on IMP's 6,7 and 8 are designed to measure fluxes as a functions of energy and to make elemental identification for protons, alpha particles and heavier ions from <1 MeV/nucleon to >400 MeV/nucleon as well as to measure the flux of relativistic electrons between 3 and 18 MeV. The separation and identification of individual elements is accomplished by measurement of differential energy loss dE/dx and total energy E using multiple detector elements. "Cancro priority systems" are used in the telemetry to ensure adequate sampling of heavier ions and higher energy particles.
The Goddard instrument package on each IMP consists of three particle telescopes covering different ranges of energy. The packages on each IMP were similar but not identical, particularly at low energies. Low energy measurements on IMP 6 were made by four (two pointed in the ecliptic, 2 pointed along the spin axis) VLED's (Very Low Energy Detectors), on IMP 7 by two (both pointed in the ecliptic plane) LET-II's (Low Energy Telescopes) and on IMP 8 by one (pointed in the ecliptic) VLET (Very Low Energy Telescope). The VLED and LET-II designs incorporated rate thresholds to distinguish particle types whereas the IMP 8 VLET used pulse-height analysis. Measurements between 0.5 and 22 MeV/Nucleon (for protons and alphas, with a somewhat higher band for heavier ions), were made by essentially identical LED's (Low Energy Detectors), one on each of IMP's 6,7 and 8. Measurements of >20 MeV/nucleon ions and electrons >3 MeV were accomplished on the IMP's by MED's (Medium Energy Detectors) with nearly identical versions of the telescope flown on IMP's 6 and 7 and a slightly modified version flown on IMP 8. A more detailed description of the experimental method and of each of the Goddard instruments follows.
The identification of elemental charge is made in the GSFC IMP instruments using rate of energy loss dE/dx as a function of total particle energy E. The general structure of any of the IMP particle telescopes is a relatively thin front detector and one or more (thicker) following detectors, each detector capable of quantitative measurement of the energy lost by a particle in it. Collimation and anticoincidence systems are also provided to exclude/distinguish particles entering at steep angles to the detector surfaces and particles of sufficient incident energy to penetrate the detector stack.
To lowest order, the total energy dE lost by an incident ion of atomic number Z and atomic mass A in penetrating a thickness dx (in g/cm3) of some material is proportional to A/Z for ions with the same incident velocity (same energy/nucleon). Thus different ions with the same MeV/nucleon penetrating a given detector all deposit different amounts of energy. If we plot total energy deposited in the front detector versus total energy remaining (e.g. Figure 1 taken from the IMP 8 VLET), we find that different ion species fall on different but distinct tracks in the display. Thus we can measure not only total ion energy but the ion atomic number (and with good resolution the isotopic mass). Note however that the range (the amount of material that an ion can penetrate) for a given ion with a given velocity goes approximately as A/Z and thus the energy ranges of analysis in a given telescope or detector stack are similar for all ion species. Measurement of energy losses by an incident particle in more than two detectors of a telescope overdetermines the charge/mass and allows better rejection of spurious counts arising for example from particles interacting within the detectors themselves or in the telescope housing in such a way as to not trigger the anticoincidence.
|
|
A substantial complication in the measurement of ion abundances is that H and He ions are generally much more abundant (by factors 3000-20000) than even the more abundant of the heavy ions such as the CNO group. elements such as Na, Al, or Ca or rare elements such as Li, Be and B. In order to obtain adequate sampling of heavy ions without unduly straining telemetry resources, "Cancro priority systems" are used in the on-board logic to give priority for pulse-height analysis and subsequent readout to selected kinds of PHA events. We construct what we call "slant thresholds", electronic thresholds against which a weighted sum of the PHA detector signals can be compared (but before full digital analysis) to define and separate event classes such as protons, alpha particles and heavy ions. At different times in the telemetry cycle, events of a given type are assigned higher or lower priority for analysis. Different particle priority classses can also be defined for particles which stop in different detector elements of a telescope. Full pulse-height analysis and storage for subsequent data transmission to the ground (if no further events are loaded in the register before readout) is then allowed for events which are of an event type of higher priority at that time than any event already stored for readout. The event type information is also used to set high gain/low gain modes in the quantitative analysis process of the instrument logic, which improves the dynamic range and digital resolution for data of a given event type. The initial electronic screening to determine event type is also used to feed rate counters which are assigned to correspond to each of the separate event types. This rate information can be combined in ground analysis with the relative distribution on a PHA matrix of those events of a given type that were pulse-height analyzed to generate absolute fluxes in given energy bands for specific elements or isotopes.
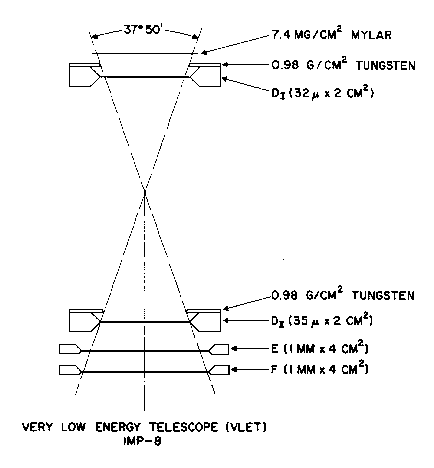
The VLET measured ions ranging from He to Ni in an energy range (in Oxygen) between 3 and 27 MeV/nucleon (1.7-13 MeV/nucleon for He and 4-51 MeV/nucleon for Fe). A schematic of the telescope is shown in Figure 2. The VLET design consists of 3 pulse-height analyzed surface-barrier detectors (labeled detectors DI, DII and E) with thicknesses respectively of 31 microns, 34 microns and 1.0 mm, with passive collimation and an active anticoincidence Si detector (labeled F). The telescope geometrical factor is 0.165 cm2-ster and is defined by the separation between DI and the DII/E detectors.
|
|
|
|
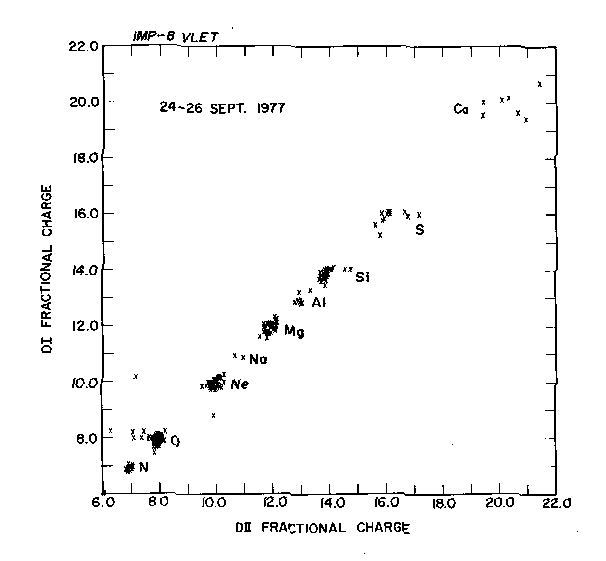
Element identification is made on the basis of differential energy loss dE/dx and total energy E in the front three detectors. Figure 1 shows flight response curves (DI detector channel versus DII detector channel) for particles stopping in the DII detector. The figure shows good track separation of the major charge groups C, N, O, Ne, Na, Mg, Al, Si and S. For the rarer elements (Li, Be, B, Na, Al, S, Ar(group), Ca(group), Ti-Cr(group)), more reliable results are obtained based only on particles stopping in the E detector, with three-detector consistency requirementsimposed for improved noise rejection. In Figure 3, we see fitted fractional charge for particles stopping in the E detector based on energy losses in the DI and DII detectors. The fractional charge for each detector is calculated by interpolation between theoretical fits to the DI or DII energy losses of successive elements and for given energy deposited in the E detector. Distinct loci of measured events are seen for each of the elements Ne, Na, Mg, Al, Si, S and Ca. A similar analysis is possible for the Li, Be, B group (Figure 4) which results in an order of magnitude or greater improvement in the upper limits which can be placed on these rare element abundances in flare events. The VLET is also capable of resolving He3 and He4 nuclei in an energy range 2.2-2.6 MeV/nucleon provided the true He3/He4 ratios are > .02.
|
|
|
|
A VLET pulse-height analyzed event can only be read out once every 2.5 seconds so that sampling of heavier ions will be severely degraded at count rates >0.2 counts/second in the more abundant H and He ions. For this reason, two electronic "slant thresholds" are defined which serve in the VLET (1) to entirely exclude protons from VLET analysis and (2) to give priority for analysis to ions heavier than He for one-half the telemetry cycles. Absolute fluxes are computed using simultaneously accumulated rates for the various priority classes.
|
|
|
|
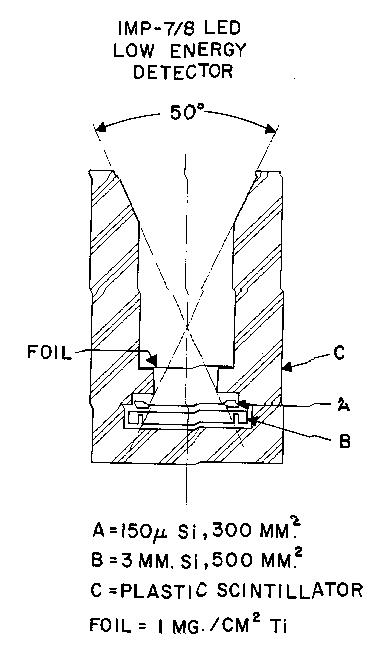
The LED's were designed to measure ions between H and Ni with an energy range of 7.5 to 40 MeV/nucleon in Oxygen (4-22 MeV/nucleon in protons and alphas, 13-87 MeV/nucleon in Fe). A schematic of the telescope is shown in Figure 5. The LED design consists of two pulse-height analyzed solid state detectors (the front or A surface-barrier Si detector of 150 micron thickness, the second or B Li-drift Si detector of 2.8 mm thickness), both detectors surrounded by active-anticoincidence plastic scintillator material (detector C). The nominal geometry factor of the instrument is 0.39 cm-ster and is defined by the entrance apertures of the thin Al casing that surrounds the anti-coincidence scintillator material. Measurement of differential energy loss dE/dx and total energy E in the A and B detectors gives elemental identification similar to that of the IMP 8 VLET, although the use of 3-parameter PHA analysis is not possible in the LED design.
|
|
|
|
Although all of the IMP detectors have rate readouts of each individual detector of each telescope to allow checks of the instrument operation, the LED design is unique in allowing useful pulse-height analysis of particles whcih stop in the front (dE/dx) detector. Such analysis is possible because the LED A detector geometry is completely defined by the plastic anti-coincidence cup (or at least its casing) so that the flux of particles stopping in the A detector can be accurately measured. However, while we have a measure of total ion energy, we can define only a lower limit to the ion charge of particles stopping in the A detetor. The lower limit exists because the maximum total energy of a particle which will stop in the A detector is lower for particles with less charge and/or mass. Thus in the lowest A detector channels, ions from H to Fe, for example, might contribute. A complication in the analysis is that the heavier nuclei in a given A detector channel will have smaller energy/nucleon values than lighter nuclei in the same channel. Thus, because, flux usually falls with increasing ion energy, the contribution of heavier ions will become more important. Nonetheless, in the lowest A detector channels (corresponding to proton energies between 0.5 and 4 MeV), the abundance of H relative to He or CNO is sufficiently large in most particle events that H dominates in these channels. Similarly, a range of A channels above the energy at which H penetrates the A detector exists (corresponding to He energies 1.4-4 MeV/nucleon) where He commonly dominates. No such simple separation of ions heavier than He is possible for A detector channels above the He penetration energy (C through Fe abundances are in general too similar) and some composite intensity measure is all that can be constructed (see McGuire et.al., 1978, for a use of this mode of operation in the study of corotating events).
It should be noted that the design of the LED (geometry factor determined by the dimensions of the casing material that surrounds the anti-coincidence scintillator), while allowing meaningful analysis of protons and alphas stopping in the front detector, has the problem that the true geometry factor and energy response of the instrument is to some degree dependent on the shape and slope of the ambient ion spectra. Departures from the nominal geometry are most significant for flat spectra or spectra where the flux actually increases with energy near and above 20 MeV/nucleon (e.g. quiet time protons). The problem is manifested by a mismatch at 20 MeV between the LED and MED portions of the quiet-time proton and alpha spectra and by the apparent early response of the LED to velocity-dispersed flare particles (i.e., the nominal 13-22 MeV LED channel sees apparent flare fluxes before any response in the 28-35 MeV MED channel is detected). In general, the LED portion of these spectra are high relative to the MED portion. Physically, particles which pass through only casing material or through too little scintillator to trigger an effective anti- coincidence pulse may appear to the LED detectors as particles of legal energy for analysis whereas their real incident energy is too high. We correct for this in analysis, particularly of quiet- time spectra, by defining an effective LED geometry factor which includes both the enhanced opening angle and modified response energies for such particles and which is larger than the nominal LED geometry factor.
With reference to figure 5, the nominal LED geometry factor is determined by the upper casing radius 1.227 cm, the lower casing radius 0.780 cm and the separation between the disks defined by these radii of 4.57 cm. The casing thickness is .04 cm with an additional vacuum gap between the casing and the scintillator material itself (all the above dimensions determined precisely by post-flight measurement of a spare LED unit). It must additionally be assumed that some thin edge of the scintillator is not efficient at producing anti-coincidence pulses. The exact thickness of this layer has been determined by Monte Carlo simulation of LED response to various ambient spectra, with a goal of matching the measured enhancement in the effective LED geomentry over nominal geometry by 38% when dJ/dE = E-gam (from quiet-time protons) and by 20% when dJ/dE = E-gam (from quiet-time alphas). A thickness of =.08 cm seems to match the experimental data; i.e., any particle that does not penetrate more deeply than .08 cm into the scintillator and whose total path length in scintillator material does not exceed 0.2 cm (a factor of 2.5 the effective depth) will not be anti-coincidenced. This gives effective upper and lower radii of 1.35 cm and 0.92 cm.
The correction factors based on this detector response model are tabulated below for the 9 flare LED energy boxes and a range of different power law indices. (Note: these correction factors are not applied to the data by the SACC FLUX or FLEX programs but only to data transferred to the 11/70 by the program FLXCOR).
|
|
4-5 |
5-6 |
6-7 |
7-11 |
11-13 |
13-16 |
16-19 |
19-22 |
|
|---|---|---|---|---|---|---|---|---|---|
|
-3 |
1.01 |
1.01 |
1.02 |
1.02 |
1.03 |
1.03 |
1.04 |
1.04 |
1.05 |
|
-2 |
1.02 |
1.02 |
1.04 |
1.04 |
1.06 |
1.06 |
1.10 |
1.10 |
1.12 |
|
-1 |
1.05 |
1.05 |
1.09 |
1.09 |
1.12 |
1.12 |
1.18 |
1.18 |
1.18 |
|
0 |
1.10 |
1.10 |
1.16 |
1.16 |
1.19 |
1.19 |
1.24 |
1.24 |
1.24 |
|
1 |
1.45 |
1.45 |
1.40 |
1.40 |
1.40 |
1.40 |
1.40 |
1.40 |
1.40 |
|
2 |
2.8 |
2.4 |
2.3 |
2.1 |
2.0 |
1.8 |
1.66 |
1.66 |
1.55 |
and the spectral form 1/CE exp (C-E/E) where the corrections are essentially independent of E.
|
E |
1.05 |
1.05 |
1.08 |
1.08 |
1.10 |
1.10 |
1.13 |
1.13 |
1.17 |
|---|
Analysis of LED quiet-time spectra also requires background subtraction. In general, LED and MED pulse-height analysis matrices show background (off-track counts) that predominantly fall below a given track. That some events might fall below a track is expected; e.g., particles that only pass through a detector edge may well have measured energy losses reduced by incomplete charge or light collection, stopping particles that pass through any structural material between the dE/dx and total E elements will appear to have lowered total E's. The separation of such events from the track on a PHA matrix is thus one means by which the geometry factor is defined and is not true background in the sense that such events are already separated from the track. Counts that appear above a given track represent a more general source of erroneous events on the track (i.e., this background probably extends under the track) and should be subtracted. Background is a particularly significant correction for LED protons because noise levels are such that counts above and below this track are nearly equal in number: thus a relatively large background subtraction is required.
Dead-time corrections are required at high anti-coincidence rates due to the finite width of the anti-coincidence electronic pulse. The LED and MED electronics are similar and the same dead- time constant is believed applicable to both. The rate correction factor for all anti-coincidenced rates is then 1/(1-R) where R is the approprite anti-coincidence singles rate. Comparing rates with and without anticoincidence (specifically the A.B with A.B.-C rate and D.E.F with D.E.F.-G rate) in various large events in the IMP database as functions of the anti- coincidence rates C or G puts an upper limit of 10 usec and a "likely" value of 8 2 usec on. Analysis of the instrument electronics (pulse widths, etc.) suggests can be no less than 4.5 usec. Inter-comparison of the detectors within the IMP package - specifically, comparison of the IMP 8 VLET alpha fluxes with IMP 7/8 LED alpha fluxes in large flares as a function the C rate - requires a minimum 7 1 usec dead-time for the LED's. We believe the MED and LED dead-time constants are similar and that the intrinsically faster electronics of the VLET validates this as a reasonable procedure. We have therefore adapted
We believe that <6 usec or >9 usec is inconsistent with the available data and above analysis.
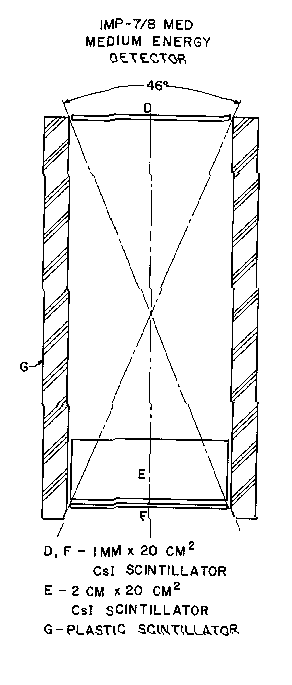
The MED's were designed to measure H and He ions from 20 to >400 MeV/nucleon and heavier ions through Ni in, for example, an Oxygen energy range 45-180 MeV/nucleon. The instrument (Figures 6) differed slightly on IMP 8 from IMP's 6 and 7. The MED design consists of three pulse-height analyzed CsI detectors (D, E and F with thicknesses respectively 1 mm, 2 cm and 1mm) and a cylindrical plastic scintillator anticoincidence shield (labeled detector G). Particles entering from the front of the telescope that pass through the dE/dx (D) detector and stop in the thicker total energy (E) detector (protons and alphas <80 MeV) and particles that penetrate into or through all three PHA analyzed detectors from either the front or the back of the telescope are analyzed. The telescope geometry factor is defined by the separation of the detectors and the nominal depth in the E detector at which the incident particles are stopped and ranges from 3.2 cm-ster for particles which just penetrate D to 2.5 cm- ster for particles which just penetrate E to nearly 5.0 cm-ster for ions >400 MeV/nucleon. It can vary both as a function of incident particle type and energy and, for penetrating particles, to some extent as a function of the ambient spectral slope since the backward view angle of the instrument is partially obstructed by spacecraft structures. It is estimated from the observational data that approximately 5 g/cm3 of material (primarily the solar panels plus the F detector photomultiplier) obscure the back entrance aperture of the telescope.
|
|
|
|
Because the PHA detectors are scintillators, all the detectors must be viewable in some fashion by photomultipliers. To accomplish this for the D and E detectors, where a photomultiplier cannot be placed in the field of view, a thin angled reflecting surface ("the tilted divider") was inserted between the D and E detectors to redirect the light emitted by these detectors to photomultiplier tubes on the sides of the telescope. The presence of this material between the two pulse-height analyzed detectors produces, however, unavoidable degradation in the intrinsic charge and energy resolution of the scintillator system. Both the thickness and the angle with respect to the telescope axis of the divider were reduced on the IMP 8 instrument in an effort to improve heavy ion resolution but relatively little effect was evident in the final flight data. In addition, resolution is effected by various non-linearties to which the scintillators are subject in their response to heavy ions and background noise levels are fairly high when looking for solar particles with typical solar abundances and steep energy spectra. Useful solar heavy ion data has been obtained thus far only in the 24 September 1977 event but good proton and alpha spectra are obtained routinely in almost all events.
The gain of the MED photomultiplier tubes is subject to change both as a long term drift with time and in transient responses to the high count rates in large solar events. Drifts in the long- term gains of the detectors can be monitored from the location and end-points of particle tracks on the basic PHA matrices and specifically by the location of the minimum ionizing peak of penetrating alphas. The gains can then be shifted numerically in the analysis to recover data normalized to standard energy boxes. Gain shifts due to high count rates are corrected with a resolution of about one hour by examination of proton and alpha tracks for E-stopping particles and their end-points. Note that very-high low-energy particle count rates can put the instrument in an effectively saturated mode and at such times no useful MED data can be obtained.
Time periods have been identified thus far however when such a saturated condition has existed in the IMP 7 and 8 missions,
|
2000 UT 13 Feb - 2000 UT 14 Feb 1978 |
|
1600 UT 30 April - 0400 UT 1 May 1978 |
|
1400 UT 23 Sept - 1800 UT 24 Sept 1978 |
|
1600 UT 12 July - 0000 UT 13 July 1982 |
For discussion of MED background subtraction and dead-time corrections, see the preceding sections on these topics in the LED description.
Dr. Robert McGuire
Last Modified:Monday, 16-Dec-96 11:27:25 EST
(G.C.G.)